Student Achievement
Emory College
Graduation rates are Emory’s primary index of student success. The traditional graduation rate for IPEDS is expressed in terms of 150% of normal time. For Emory College, this is the percentage of the FTFT cohort that completes their undergraduate degree within six years. Emory’s six-year graduation rates have remained relatively constant at around 90% for the past few cohorts. Of the roughly 1,400 new students that join Emory each fall, approximately 1260 of them graduate within six-years and about 140 students leave Emory College at some point in their undergraduate career. Emory invests in each of these students and wants to ensure their ultimate success. Emory does not consider itself a transfer preparatory institution.
Fall Cohort | 2015 | 2014 | 2013 | 2012 | 2011 | 2010 | 2009 | 2008 | 2007 | 2006 |
Emory | 90% | 90% | 90% | 90% | 91% | 91% | 89% | 89% | 90% | 89% |
Peers | 95% | 95% | 94% | 95% | 94% | 94% | 94% | 94% | 94% | 94% |
Source: IPEDS Data Center
Peer Institutions: Institutions that Emory University seeks to be comparable within the type, size, and offerings. Duke University, John Hopkins University, Northwestern University, University of Pennsylvania, Vanderbilt University, and Washington University in St. Louis
Our goal is that 94% of first-time, full-time students will graduate in six years and 87% in four years. Emory has established an institutional threshold of 85% six-year graduation rate. Our peer institutional average is 95%. The goal of 94% will bring us closer to the average six-year graduation rates of our peer institutions.
Pell Grant
IPEDS collects information annually pertaining to graduation rates for Pell recipients. While a limited proxy for socioeconomic status, Pell recipient status tends to indicate a presence of lower income students on campus. At Emory, approximately 19% of undergraduates receive Pell awards.
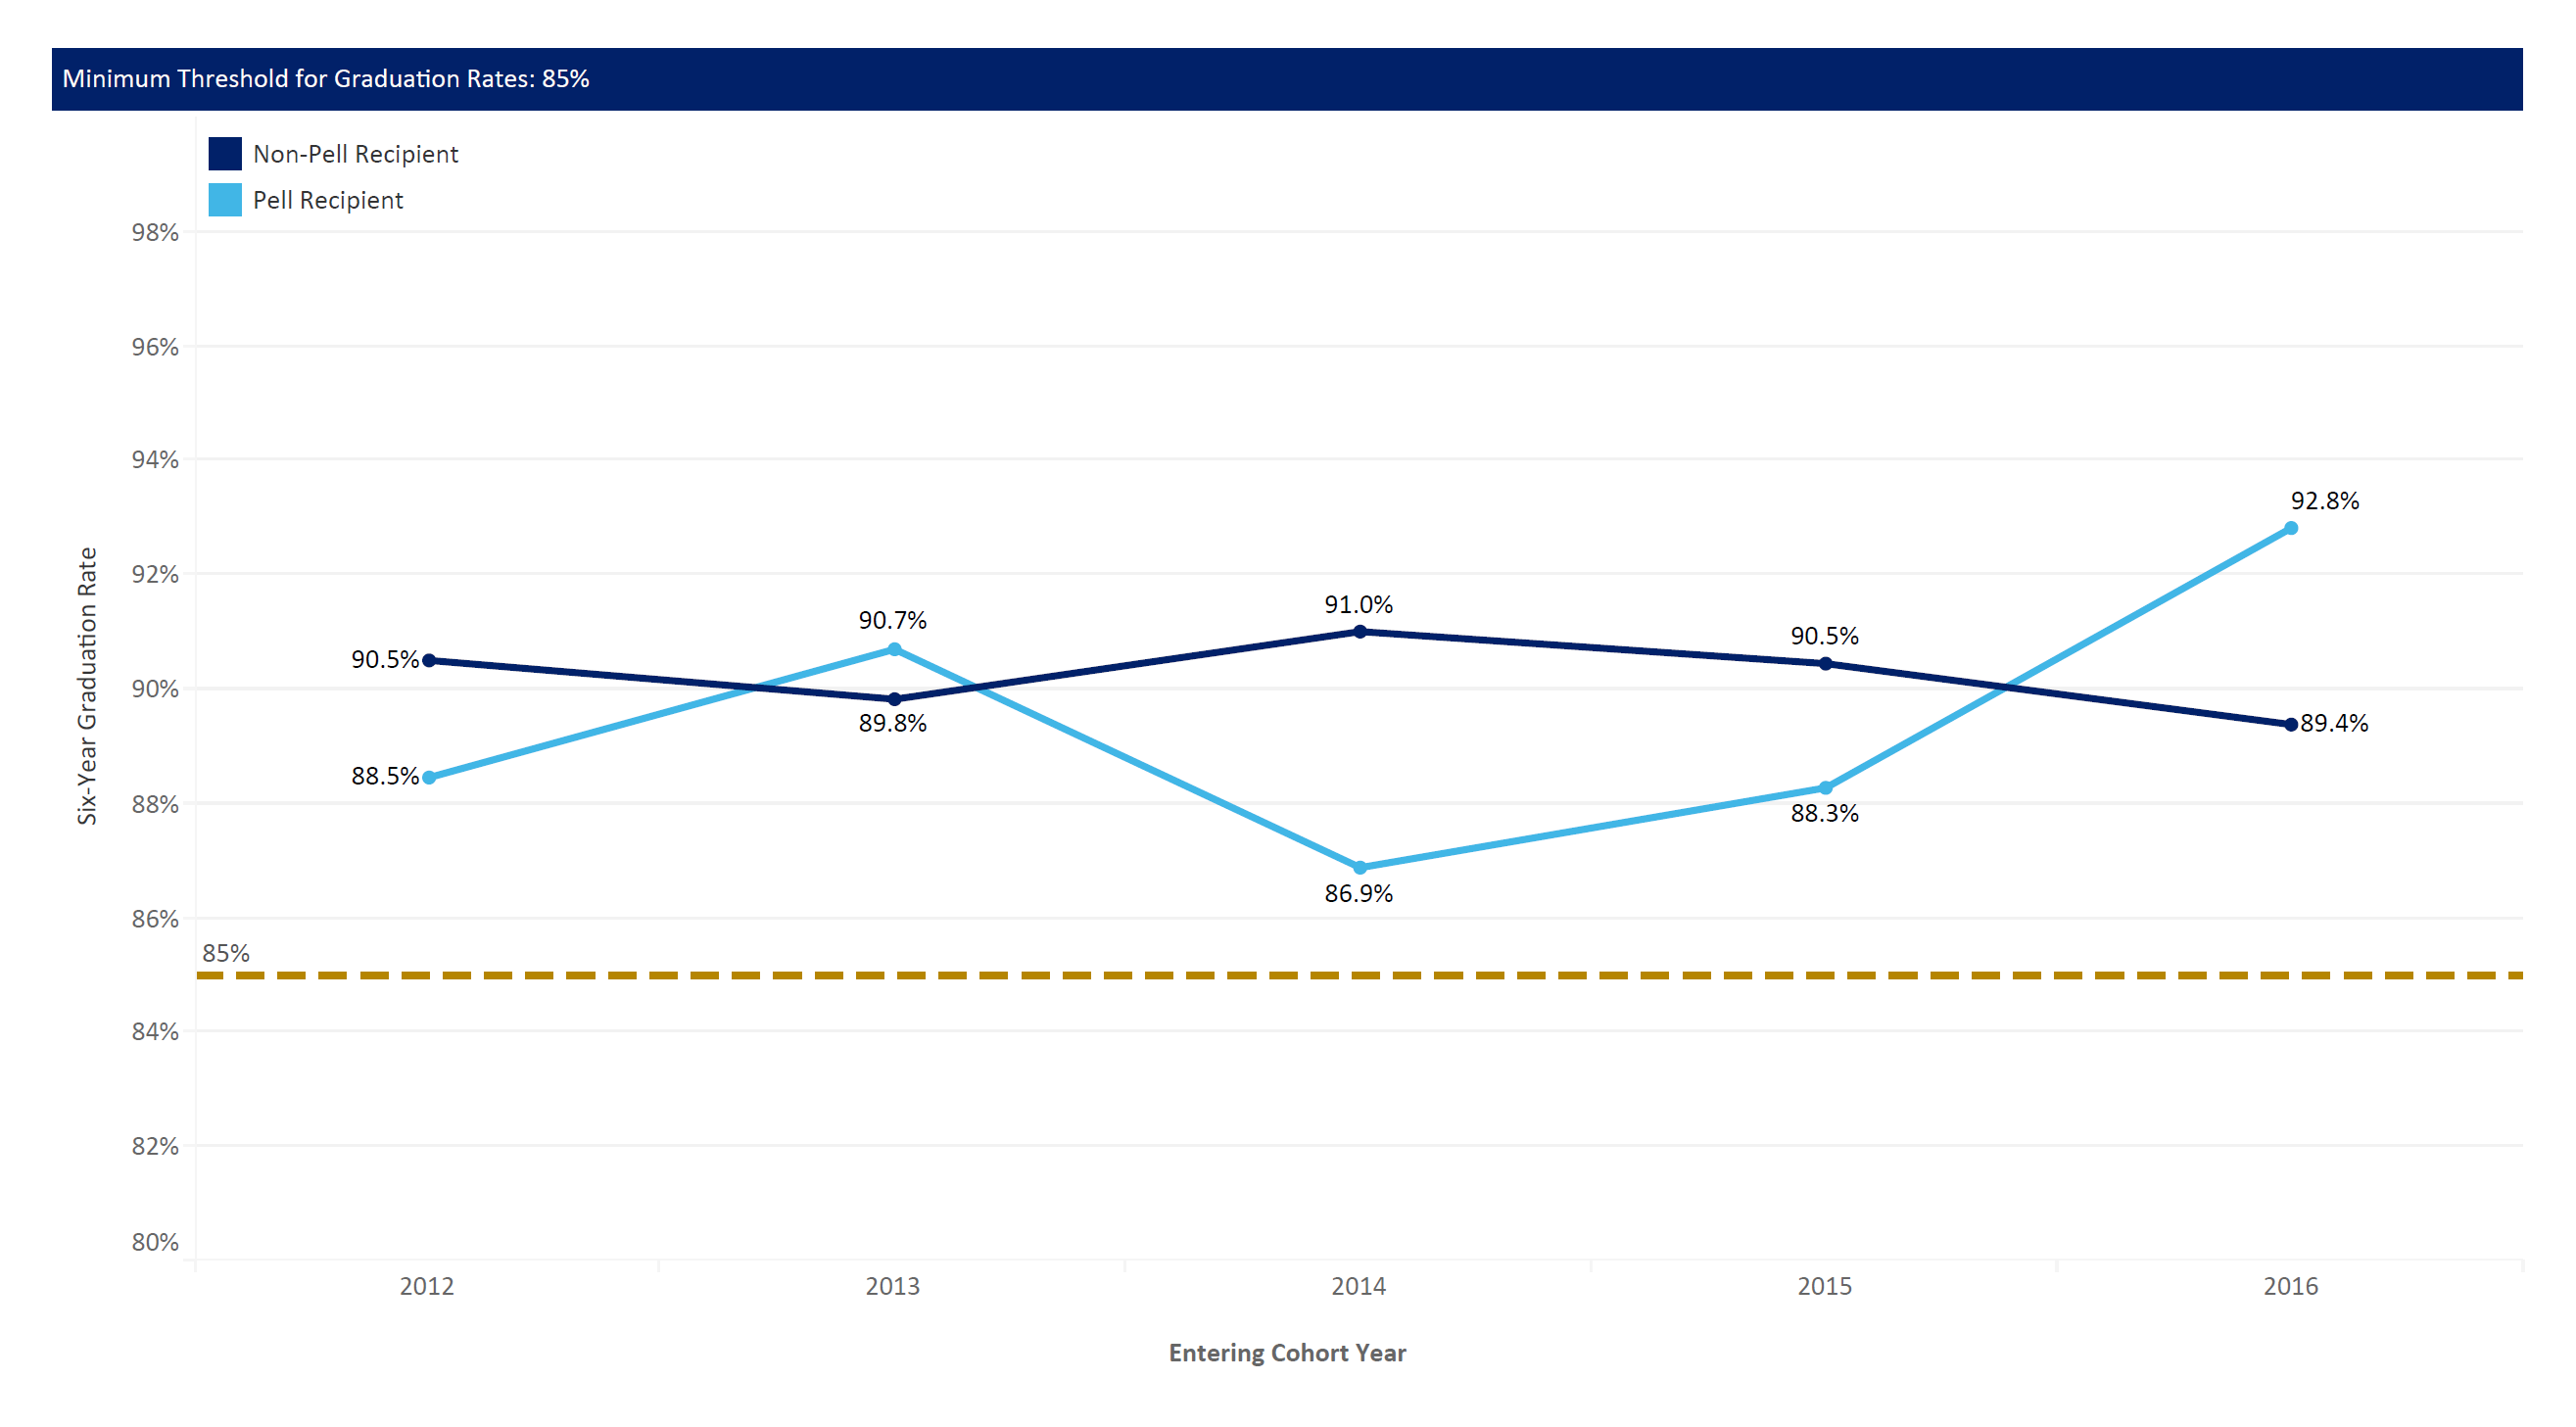
Figure 3. Emory College: Six-Year Graduation Rates by Pell Grant
Graduation rates for Pell students, as shown in Figure 3., have traditionally slightly lagged those of non-Pell recipient peers, but 2013 and 2016 cohorts showed a reversal. For the 2016 cohort, Pell recipients outperformed their peers with a 92.8% six-year graduation rate as compared to 89.4% for non-recipients. Again, these rates for both groups are very encouraging as they have remained well above the institutional threshold of 85% in the past five years.
Our goal is to eliminate socio-economic status related gaps in graduation rates. In addition,94% of all first-time, full-time Pell and Non-Pell recipients will graduate in six years and 87% in four years.
Some Emory initiatives to address these disaggregated rates include the following programs:
- Degree Tracker has been designed to empower students with an interactive degree audit report that clearly lists the courses completed and in progress (including which ones will satisfy graduation requirements). Degree tracker also provides accurate listings of courses that can be used to satisfy outstanding requirements.
- Emory’s Undergraduate grant, scholarship, and tuition benefit programs offer financial assistance to eligible students in addition to federal and state grants, scholarships, and loan options. Emory University Grant, BBA Grant, Nursing School Grant & Irene Woodruff Grant, Emory Advantage, and Education Abroad Scholarships are Emory’sneed-based grants and scholarships. Woodruff Scholars Program, Emory Opportunity Award, Woodruff Dean’s Achievement Scholarship, George W. Jenkins Scholarship, Liberal Arts Scholarship, Oxford Scholars Program, BBA Dean’s Scholarship, Lettie Pate Whitehead Scholarship, Questbridge, and National Merit Scholarship are Emory’s merit scholarship programs. Courtesy Tuition Benefit for Undergraduates and Unit Methodist Ministerial Tuition Benefit are Emory’s tuition benefit programs.
Oxford College
Oxford College, as a two-year, associate’s degree granting institution requires a slightly different methodology for graduation rates. The traditional graduation rate for IPEDS is expressed in terms of 150% of normal time. For Oxford College, this is the percent of the first-time, full-time cohort that completes their associate’s degree within three years.
Figure 4 displays the three-year graduation rate for Oxford College. Over the past five years, Oxford’s graduation rates have followed a steady path of improvement, reaching a peak with the most recent cohort. Students from the entering fall cohort in 2019 graduated at a 95.3% rate as of summer 2022.
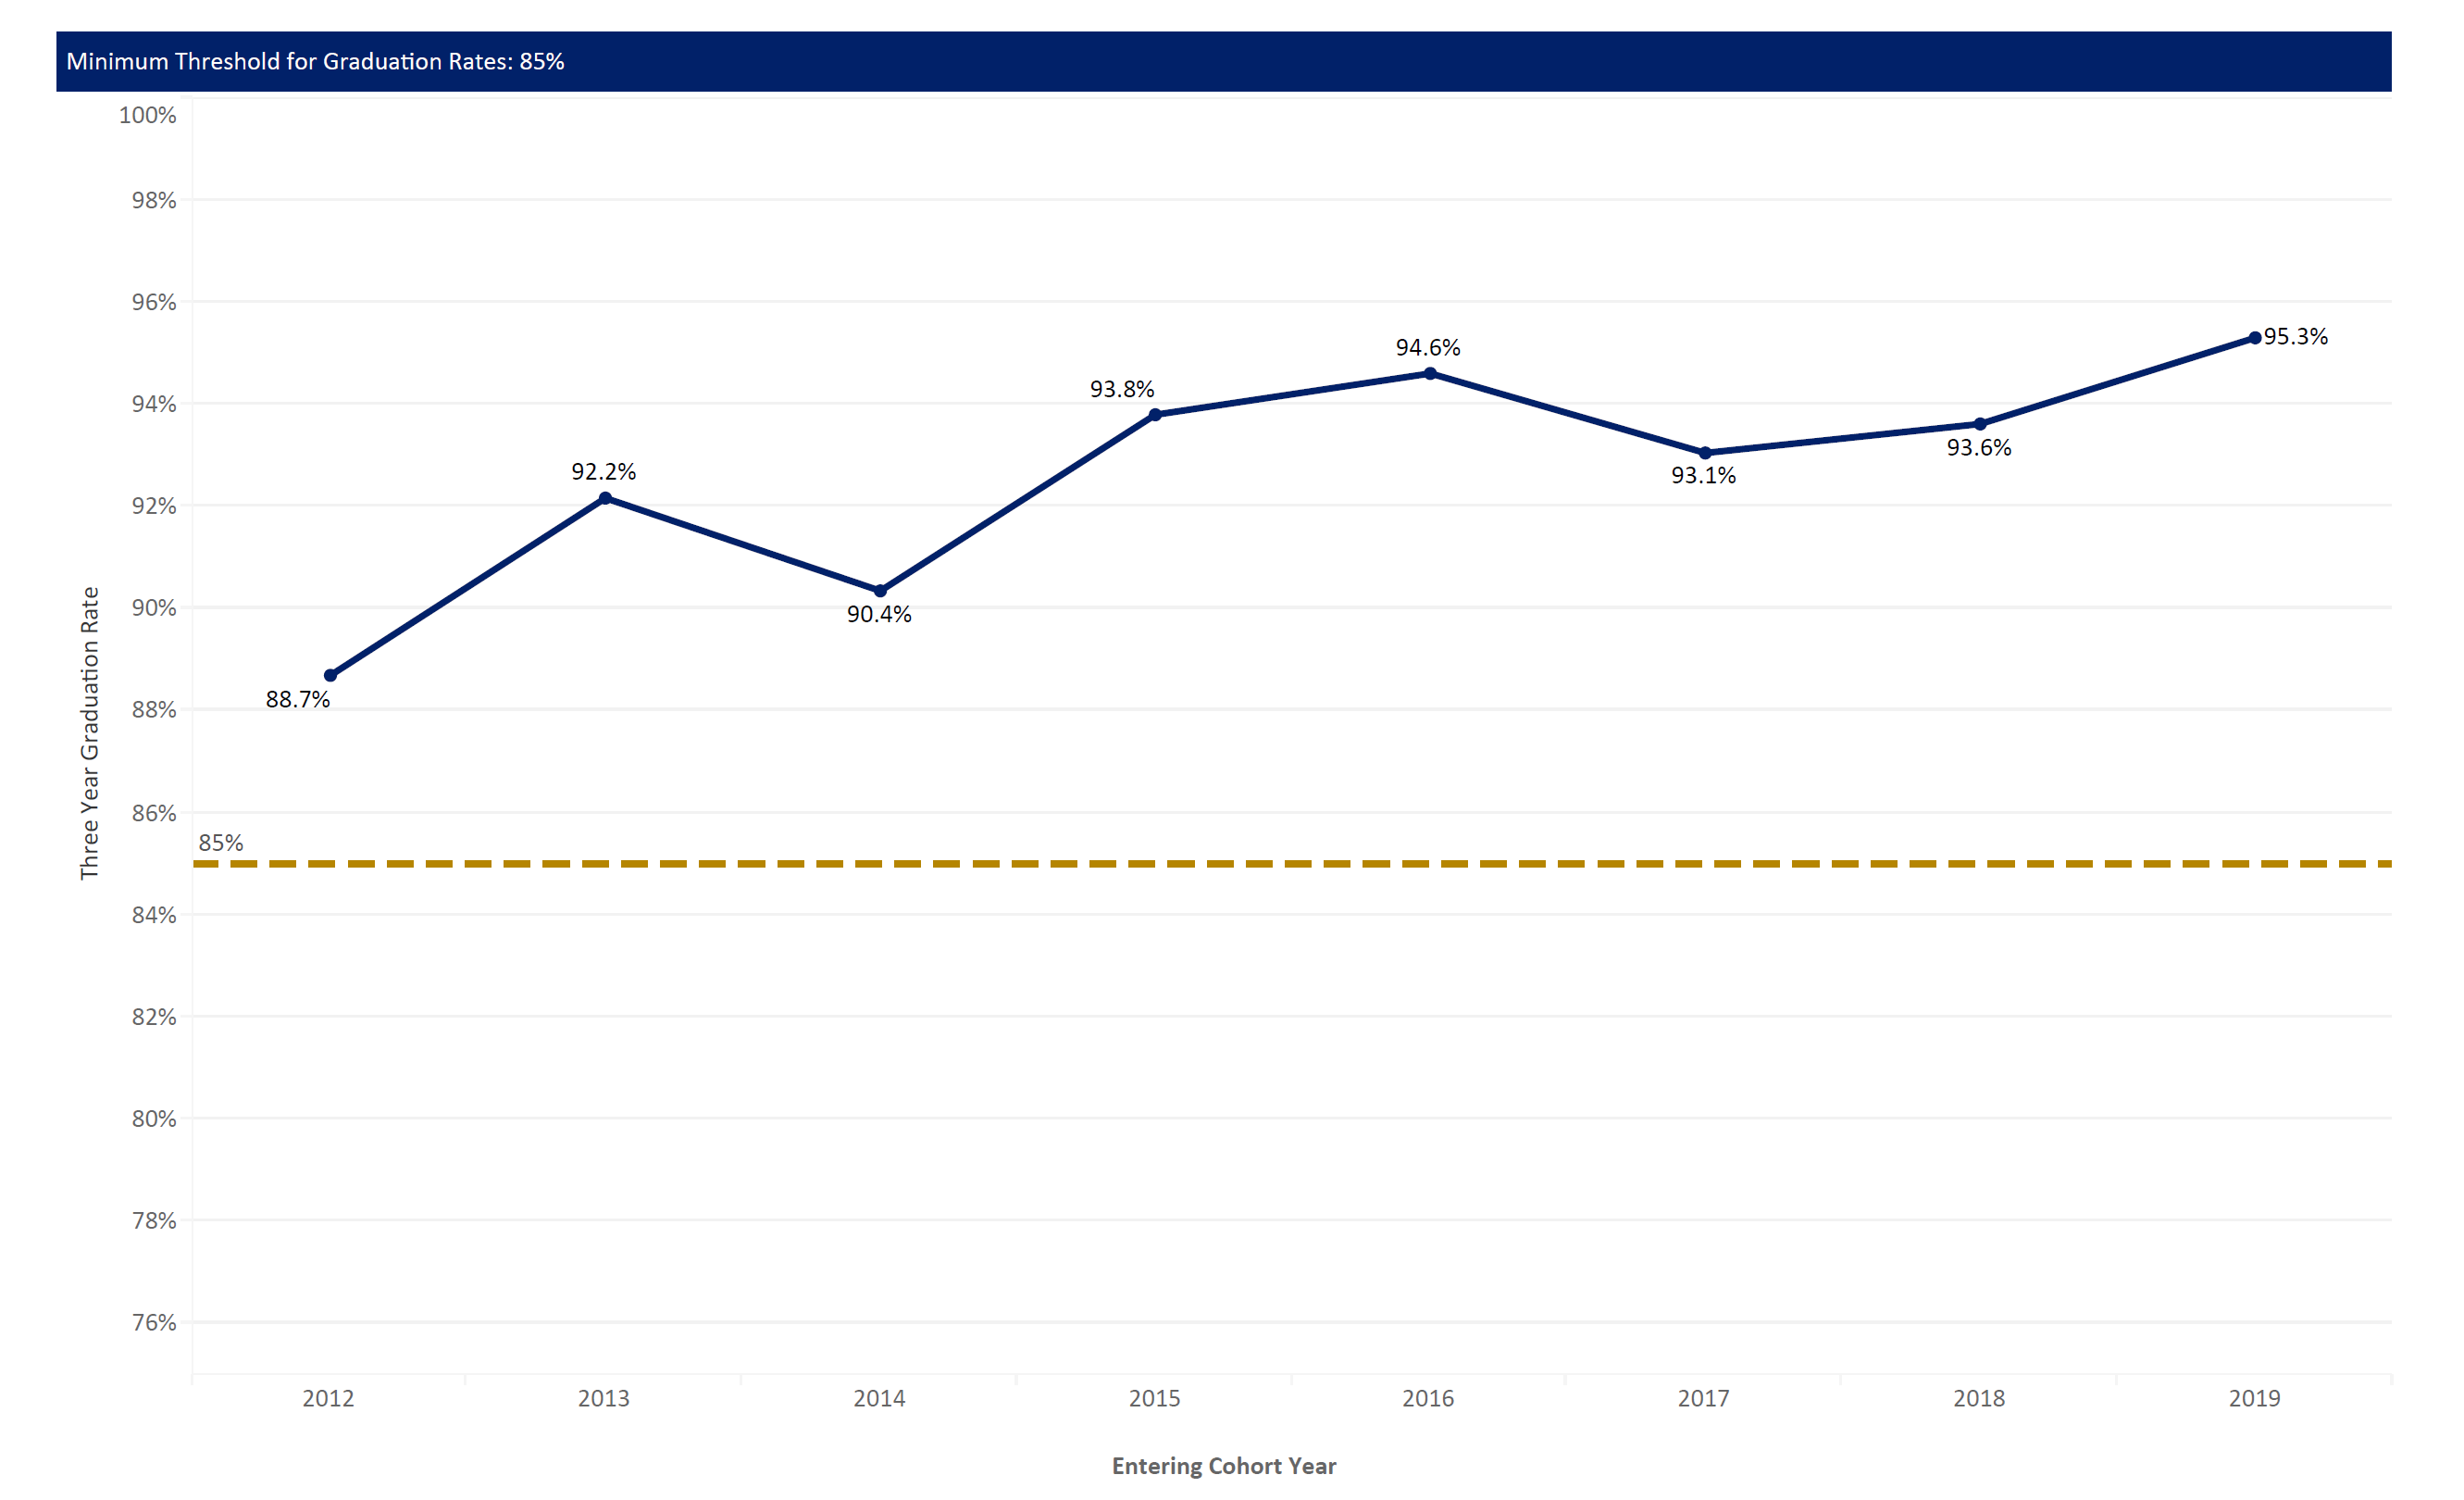
Figure 4. Oxford College: Three-Year Graduation Rates Over Time
Oxford College’s graduation rates exceed the threshold of 85% as set by senior leadership. Of the over 1500 degree granting, two-year institutions tracked in the IPEDS Data Center, Oxford is in the top 25 of performance on three-year graduation rates with most of these top-tier institutions graduating a small number of students each year as compared to annual cohorts of 450 for Oxford.
Our goal is that 96% of first-time, full-time students will graduate in three years and 94% in two years.
Pell Grant
IPEDS collects graduation rate information annually for Pell Grant recipients. Approximately 21% of Oxford College students receive Pell Grants. Figure 7 presents the three-year graduation rate for Oxford cohorts based on whether students received a Pell Grant.
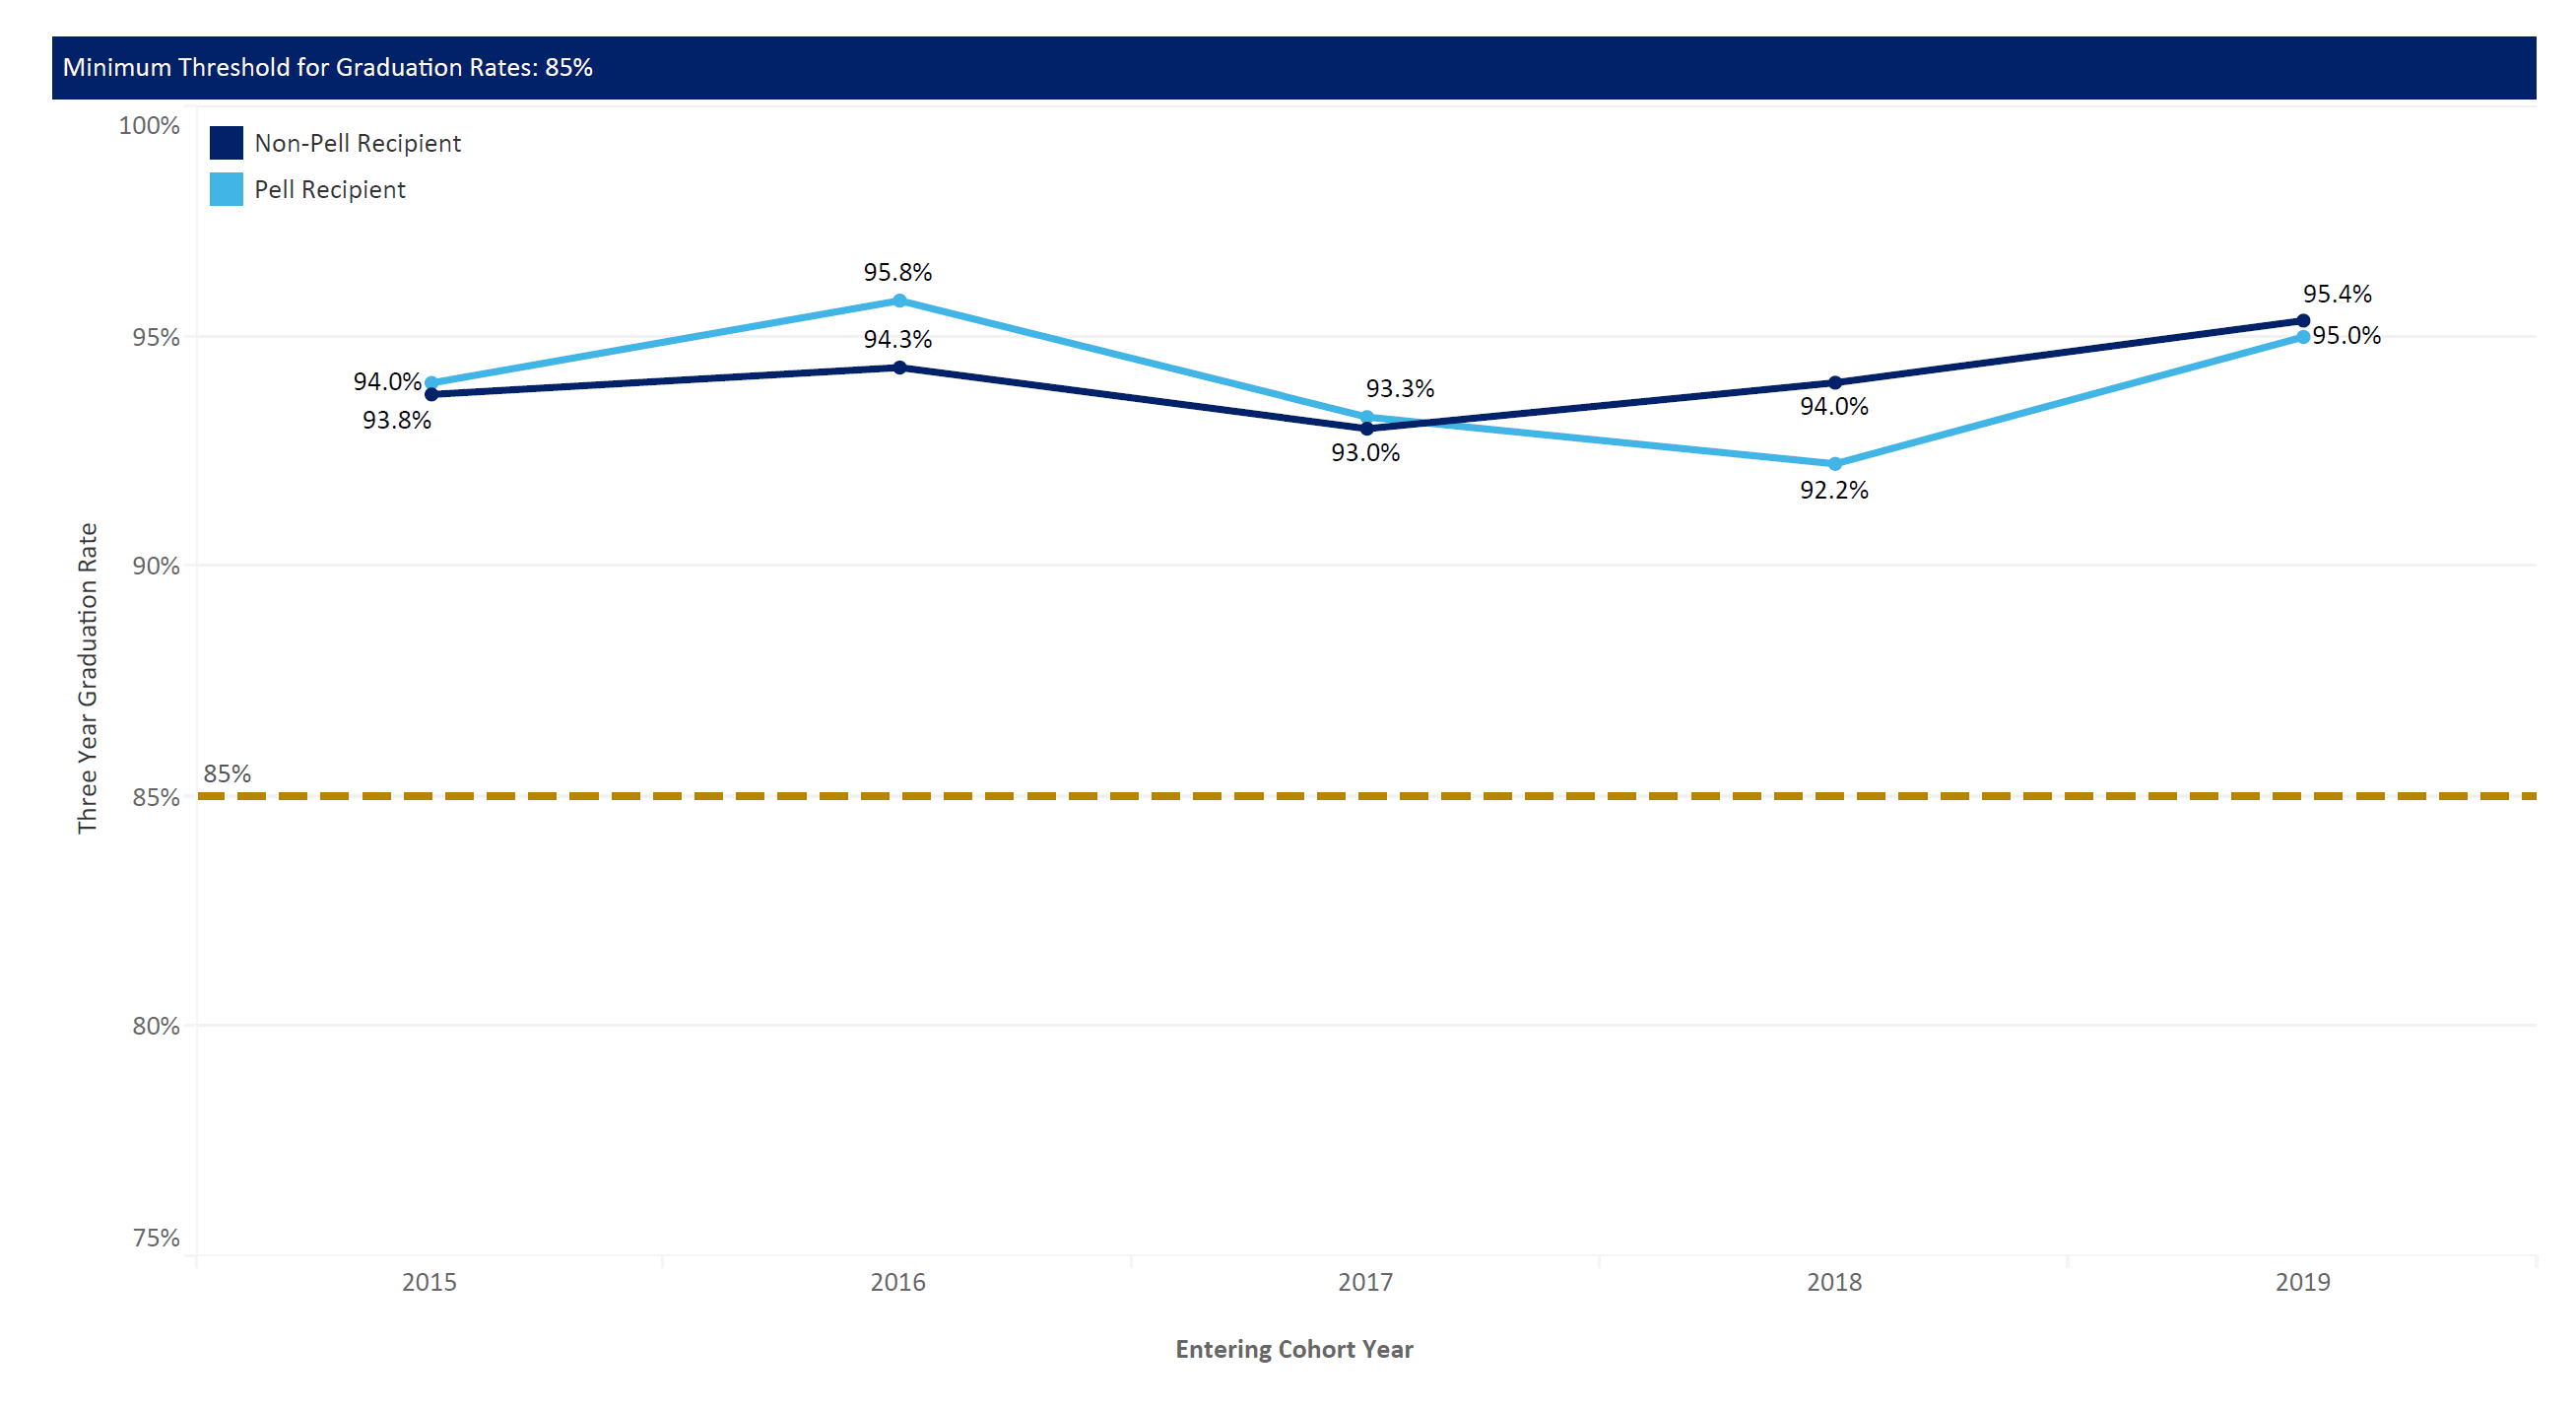
Figure 7. Oxford College: Three-Year Graduation Rates by Pell Recipient Status
For the 20149 cohort, the three-year graduation rate for both Pell recipients and non-Pell recipients at Oxford College was roughly same around 95%. Both Pell and non-Pell recipients exceeded the institutional threshold of 85%.
Our goal is to eliminate socio-economic status related gaps in graduation rates. In addition,96% of all first-time, full-time Pell and Non-Pell recipients will graduate in three years and 94% in two years.
Emory College
Emory University is home to the Emory College of Arts and Sciences, where all incoming freshmen to the Atlanta campus begin their college careers. Almost all first-time students at Emory are full-time admits in the fall. Indeed, Emory has only twice had part-time entrants in the fall, two students began in fall 2018 and one in fall 2020. Non-traditional populations of part-time and spring entrants are rare in the overall undergraduate population.
Over the past decade, Emory’s first-year retention rates have tended to hover between 93% and 95% with some small variability from year to year. Emory compares its first-year retention rate to selected peer institutions.
Fall Cohort | 2020 | 2019 | 2018 | 2017 | 2016 | 2015 | 2014 | 2013 | 2012 | 2011 |
Emory | 95% | 93% | 95% | 95% | 93% | 94% | 94% | 95% | 94% | 95% |
Peers | 97% | 96% | 98% | 97% | 97% | 97% | 97% | 97% | 97% | 97% |
Source: IPEDS Data Center
Peer Institutions: Institutions that Emory University seeks to be comparable within the type, size, and offerings. Duke University, John Hopkins University, Northwestern University, University of Pennsylvania, Vanderbilt University, and Washington University in St. Louis
Our goal is that 97% of first-time, full-time students will return for their second year. Emory has established an institutional threshold of 90% first-year retention rate. This baseline was established by senior leadership after reviewing historical data, national trends, and peer benchmarks. Our peer institutional average is 97%. The goal of 97% will put Emory’s first-year retention rate within range of its peer institutions.
Oxford College
Emory University is comprised of two separate IPEDS institutions. In addition to Emory College, Emory University also operates a two-year, liberal arts campus in Oxford, Georgia. Oxford College received more than 20,000 applications in Fall 2021 and recorded a 19.8% acceptance rate. The SAT interquartile range spanned from 1440 to 1520 with ACT scores ranging from 32 to 34. As with its peer campus at Emory College in Atlanta, Oxford College has a strong history of high retention rates.
Figure 1. Oxford College: First-Year Retention Rates Over Time
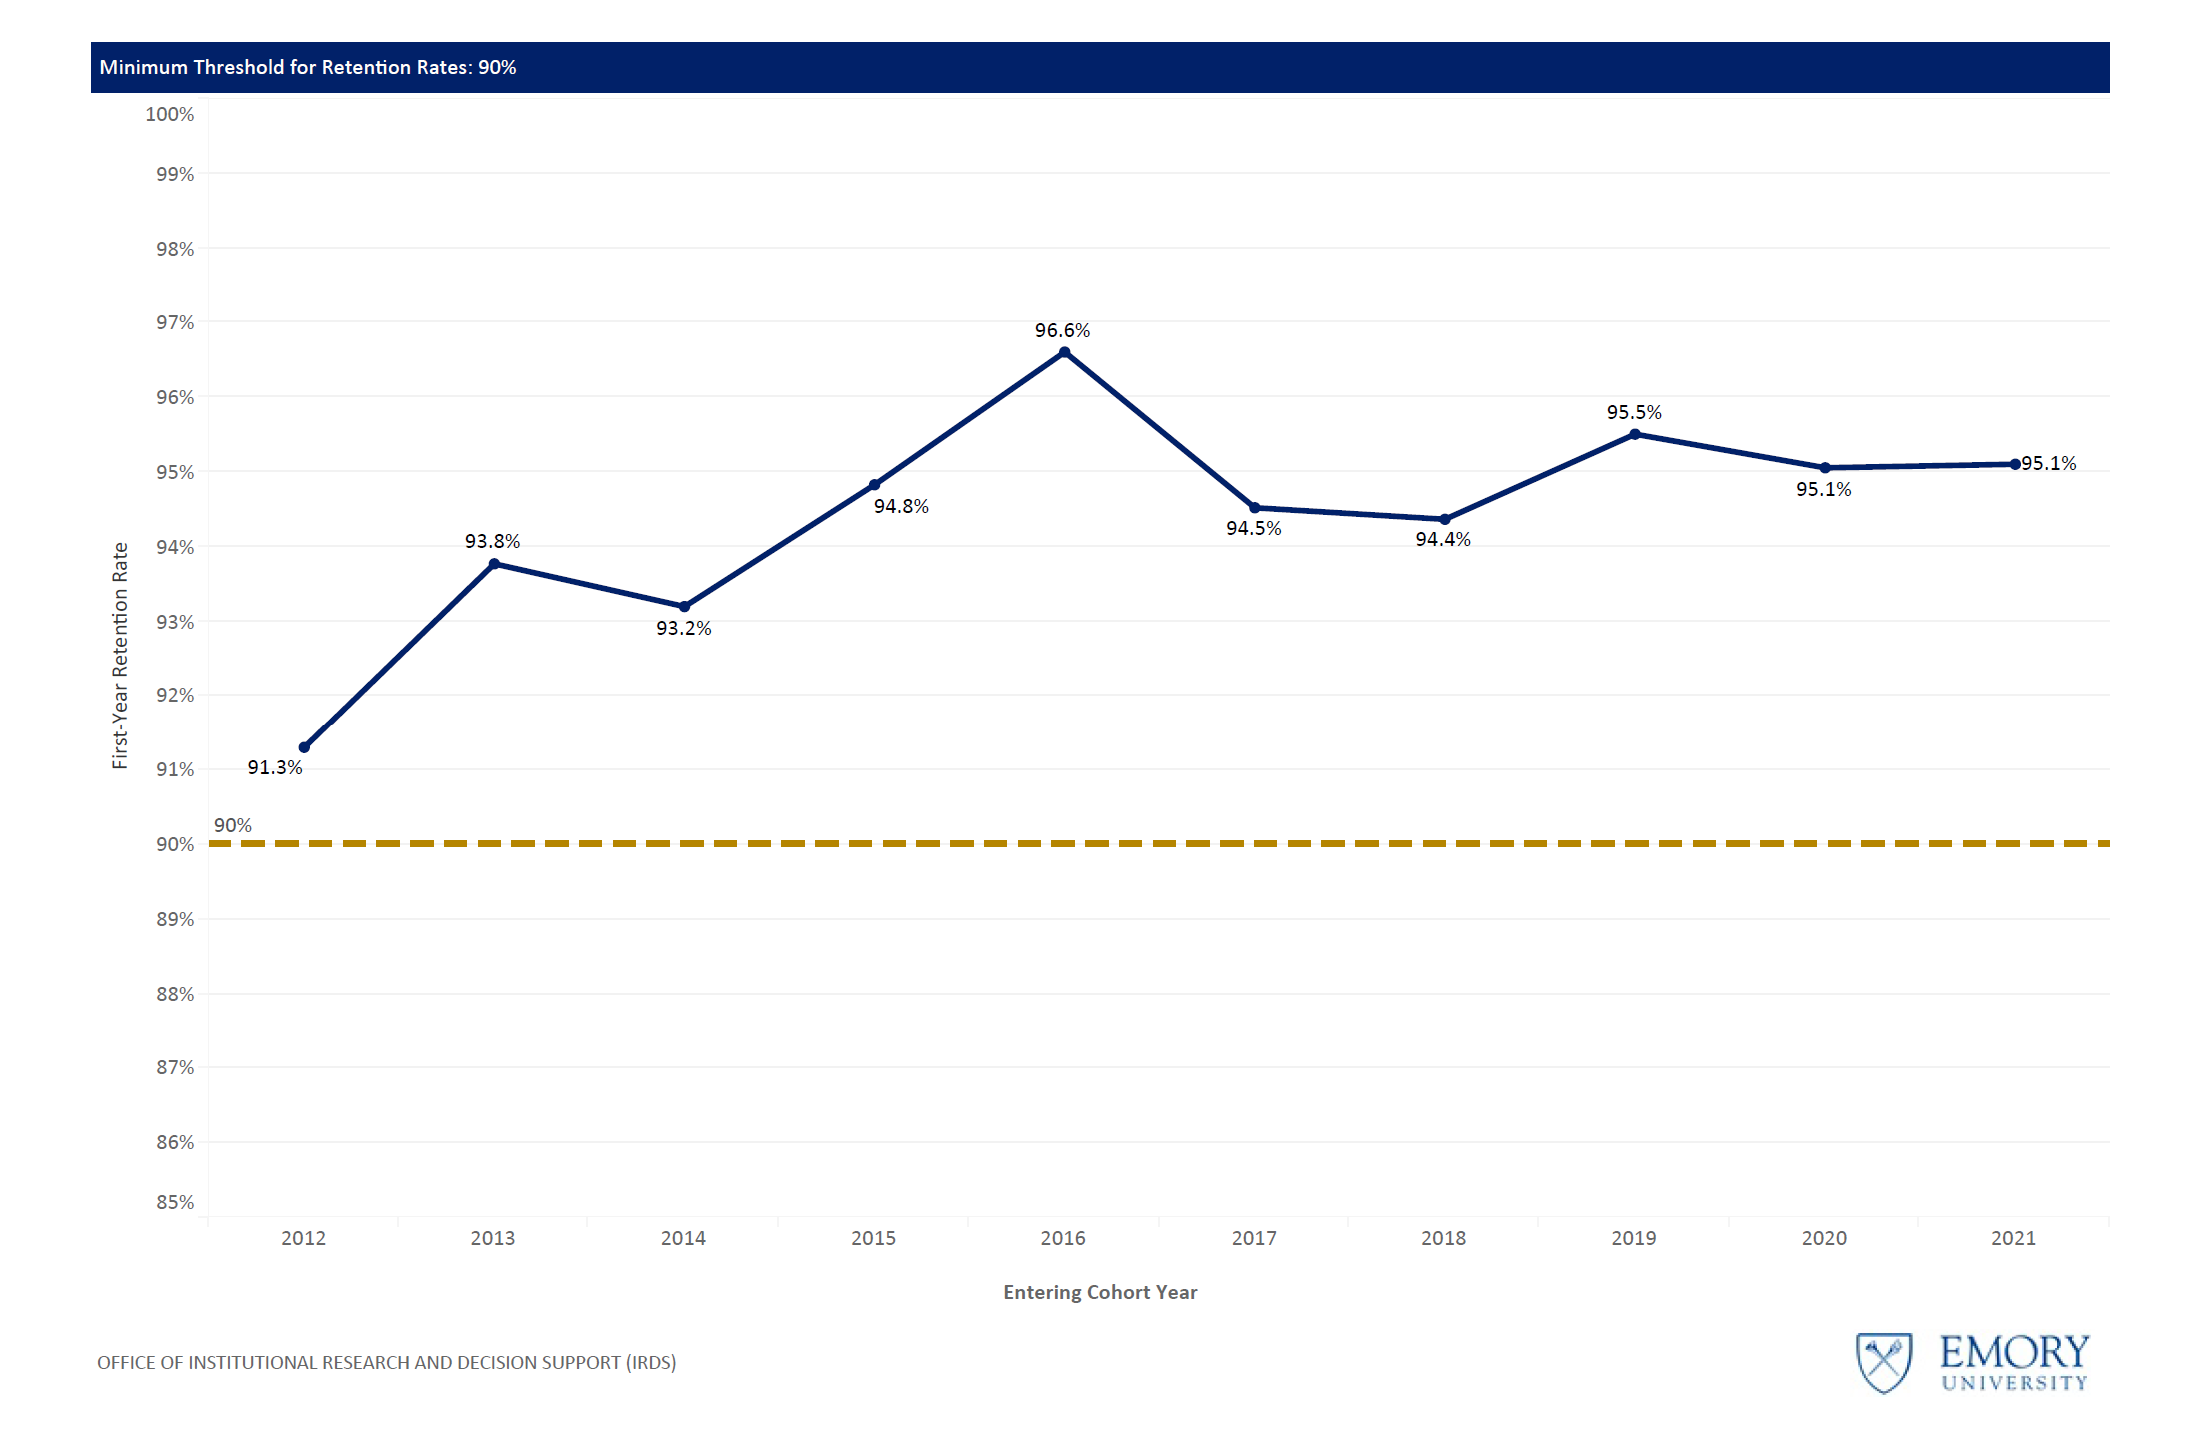
As with Emory College, these rates exceed the minimum threshold of 90% as set by senior leadership. The national average for two-year institutions is a 61% retention rate and slightly higher for private, non-profit institutions at 68%. Oxford’s 95.1% retention rate is nearly thirty-five percentage points higher than other two-year institutions throughout the country.
Our goal is that 97% of first-time, full-time students will return for their second year.
Time-to-Degree, Licensing Exams & Placement Rates
Another area of student achievement that Emory examines is linked to ensuring that students are well positioned to join their chosen profession upon graduation. Each school has established base levels of performance for tracking their graduates. For most schools, metrics include professional licensing examinations and/or placement rates. The Laney Graduate School focuses on time-to-degree and ensuring that students are able to complete their degree within established timelines.
Time-to-Degree
The Laney Graduate School provides an extensive list of resources on their webpage that describe the admissions, enrollment, and time-to-degree for their programs. In particular, the metrics associated with time-to-degree are particularly relevant as measures of student outcomes. The overall median time-to-degree for doctoral programs has remained steady around 5.8 years.
Laney Graduation School PhD Median Time-to-Degree
Concentration | TTD | Threshold |
Humanities | 5.8 | 7.0 |
Social Sciences | 5.8 | 5.5 |
Natural Sciences & STEM | 5.3 | 5.5 |
The institutional thresholds for various degree programs by broad discipline were set by senior leadership in Laney Graduate School through discussions with administrators and faculty about the nature of each discipline. In addition, national standards within each discipline were reviewed using peer data from sources such as the Association of American Universities Data Exchange (AAUDE) and Council of Graduate Schools (CGS). Emory has also partnered with the Coalition for Next Generation Life Sciences to share degree program information transparently.
Professional Licensing Examinations
The remaining schools focus on licensure exams or on placement rates following graduation. Senior leadership in Emory colleges and schools established thresholds based on historical review, benchmark analysis, professional accreditation standards, and discussion with faculty and program administrators.
For licensure thresholds, the minimum rate was most often set using pre-established guidelines published by program specific accreditors. Licensure is a pre-requisite for practice in many professions. Nursing, Law, and Medicine are schools whose graduates most heavily rely on passing a professional certifying exam.
Licensure Results and Thresholds by School
Value | Threshold | ||
Nell Hodgson Woodruff School of Nursing |
|
| |
NCLEX (2021) Pass Rate | 87% | 80% | |
Nurse-Midwifery Overall Pass Rate (2021) | 86% | 80% | |
Emergency Nurse Practitioner Pass Rate (2017) | 100% | 80% | |
School of Law |
|
| |
Ultimate Bar Passage Rate | 91% | 75% | |
First-Time Bar Passage Rate | 87% | 75% | |
School of Medicine |
|
| |
Doctor of Physical Therapy State Licensure Exam Pass Rate | 100% | 94% | |
Physician Assistant National Certifying Examination Pass Rate | 91% | 93% | |
American Board of Genetic Counseling First-Time Pass Rate | 90% | 78% | |
Certifying Examination for Anesthesiologist Assistants Pass Rate | 93% | 89% | |
Medical Imaging Pass Rate for American Registry of Radiologic Technologists | 92% | 84% | |
MD U. S. Medical Licensing Examination National Board of Medical Examiners | 91% | 93% | |
MD Clinical Knowledge National Board of Medical Examiners | 99% | 99% | |
Placement Rates
In moving to outcomes based on employment, the senior leadership and faculty of the schools again were instrumental in developing thresholds. While certain schools and programs have pre-established baselines for employment outcomes that are set by professional accrediting organizations, most employment outcomes were established using historical data, benchmark analysis, and national economic and marketplace fluctuations.
Employment/Placement Results and Thresholds by School
Value | Threshold | ||
Candler School of Theology | |||
Master of Divinity Employment After Graduation | 92% | 50% | |
Master of Theological Studies Employment After Graduation | 60% | 50% | |
Master of Religion and Public Life Employment After Graduation | 100% | 50% | |
Emory College of Arts & Sciences | |||
Placement Rate | 91% | 80% | |
Goizueta Business School | |||
BBA Employment within 3 Months of Graduation | 97% | 80% | |
MBA Employment within 3 Months of Graduation | 98% | 80% | |
One-Year MBA Employment within 3 Months of Graduation | 94% | 80% | |
MS in Business Analytics Employment within 3 Months of Graduation | 96% | 80% | |
Nell Hodgson Woodruff School of Nursing | |||
BSN Employment within 3 Months of Graduation | 90% | 70% | |
MSN Employment within 3 Months of Graduation | 92% | 70% | |
Rollins School of Public Health | |||
Placement Rate within 12 Months of Graduation | 82% | 80% | |
School of Law | |||
Full-Time, Long-Term Employment | 90% | 75% | |